

School communities approach building positive climate in their own ways. For example, at Green Springs Elementary School in Olathe, Kansas, you might hear about #GatorGrit and how students and staff practice perseverance.
While every school community is different, benchmarking against national norms is one useful way to understand your district's progress. When your students and families reflect on school climate, how do their perceptions compare to others nationally? How do your students' life skills competencies — like Self-Management and Growth Mindset — look compared to national norms?
To help you decide where to focus your efforts, it’s critical to know where your survey scores stack up against others. In this article, we walk through the different types of survey benchmarks you can use. We also explore real examples of how districts are benchmarking their school climate and life skills data to identify areas for celebration and improvement.
What are Survey Benchmarks?
Benchmarks help to contextualize your school or district's survey results by stacking them up against the results of other schools and districts. By using benchmarks, you can get a more complete picture of your survey data in order to set actionable goals for improvement.
For example, let's say you've gathered life skills data from your students. Only 45 percent of students report a high Sense of Belonging, but 75 percent of students report having Self-Management skills. Your Sense of Belonging score may seem low compared to the Self-Management score. However, you may find that your Sense of Belonging score is actually higher than the average score on that topic for other schools in the nation.
You may also see a range of scores within your own district, prompting you to learn from positive outliers or to intervene when results are not on par with district averages.
Here are some different ways to benchmark your survey data:
- School - Looking at results compared to other schools in your district
- District - Viewing scores with reference to overall district averages
- National - Seeing how results compare to national norms
- Peer - Comparing results to schools with a similar geographic setting (Urban or Non-Urban), school level (Elementary, Middle, or High School), or Free and Reduced Price Lunch (FRPL) percentage
How to Visualize Survey Benchmarks
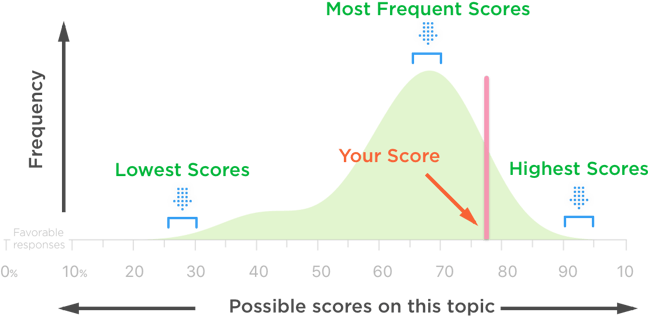
The most common way to represent benchmarks is with a distribution graph. Shown below, a distribution graph visualizes the range of scores and the frequency of scores on a particular survey topic. That means you can see how your score compares to the highest, lowest, and most frequent results.
If you use Panorama's Benchmarks feature, your survey results will automatically display on distribution graphs with your national percentile rankings. Panorama's Benchmarks are based on survey results from more than 3.5 million student, staff, and family members across diverse geographic areas, socio-economic community contexts, and school types. This means that you can benchmark your survey results in a variety of ways — nationally and against communities that look like yours.
How Districts Are Using Benchmarks to Improve School Climate
Here are a four examples of survey benchmarks in action.
1. Wake County Public School System (North Carolina)
Community engagement is one of the five core objectives in Wake County Public School System's (WCPSS) “Vision 2020” Strategic Plan. As one way to meet this objective, WCPSS gathers survey feedback from families on topics including Family Support, Family Engagement, and School Climate.
Once the results are in, administrators at WCPSS benchmark their data at the school, district, and national levels. This helps them see how they stack up and identify levers they can pull to strengthen family engagement.
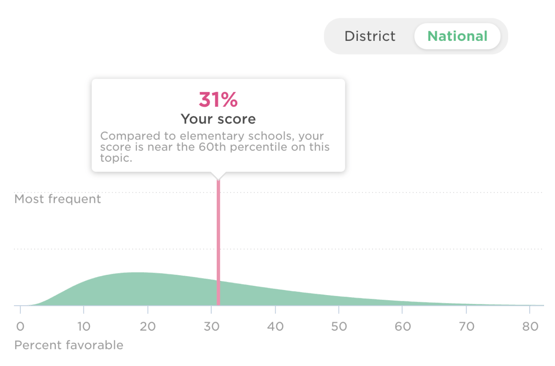
Shown in the graph above, WCPSS's Stough Elementary School showed a Family Engagement score that was above the national average (60th percentile) compared to other elementary schools.
Even so, the Stough team wanted to move that metric upwards. They went to work planning even more ways to develop partnerships with families. As a direct response to the data, they reimagined parent-teacher conferences by hosting a literacy-themed "family-teacher night" — which attracted more than double the typical number of attendees they typically see at family events.
2. Hilliard City Schools (Ohio)
Results from Hilliard's life skills assessments mirrored this trend. Students at Hilliard — particularly those in grades six through 12 — were reporting levels of belonging that were below average compared to other districts nationally.
With these benchmarks in hand, Walker and the Hilliard team deepened their focus on students' sense of belonging. The district created resources for principals and teachers and provided professional development on how to build students' belonging. For example, teachers are now making a conscious effort to help students find things in common before group work starts.
The Hilliard team plans to monitor their sense of belonging data against benchmarks every semester to see if these strategies move the needle, or if they need to change course.
3. Long Beach Unified School District (California)
For Long Beach Unified School District (LBUSD), life skills data benchmarks are critical to understanding how educators can best support student growth — both academically and socially.
During the 2014-2015 school year, LBUSD's MacArthur Elementary received survey results showing that only five out of 10 students had a growth mindset. This placed MacArthur Elementary in the bottom 20th percentile on the Growth Mindset survey topic compared to other schools in Panorama’s benchmarks.
To improve this data point, the school hosted professional development workshops for teachers and “parent university” nights that focused on the research and importance of growth mindset. They also began using positive reinforcement tactics with students and providing explicit instruction about the malleability of the brain.
The next year, MacArthur Elementary's students reflected Growth Mindset scores in the 90th percentile. This upward trend continued into the 2016-2017 school year, when students' scores in Growth Mindset rose by another five percentage points.
4. Park Hill School District (Missouri)
Park Hill School District has a system-wide focus on improving school quality and creating a positive school climate for its 11,000 students. To measure progress towards that goal, Park Hill collects survey feedback from students on several aspects of their school experience, looking at topics such as Teacher-Student Relationships, Sense of Belonging, School Climate, and School Safety.
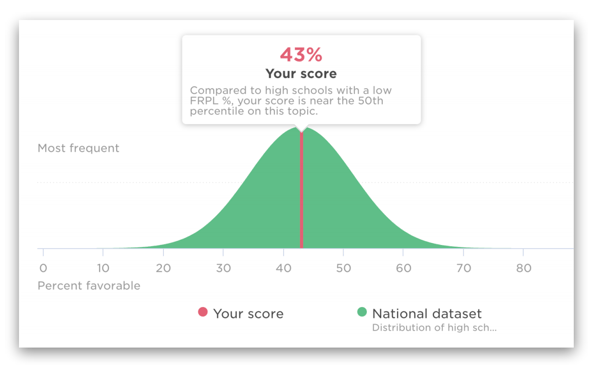
Park Hill’s recent survey results ranked in the 70th percentile or higher compared to data from similar districts. This is a benchmark that the district strives to hit. On the other hand, Park Hill's Sense of Belonging score ranked in the 50th percentile — right in the middle of similar districts.
In response to this data point, Park Hill administrators deployed two new strategies across schools: a culturally responsive teaching framework and an AVID (Advancement Via Individual Determination) college-readiness program. They plan to continue gathering student feedback year over year to monitor the impact of these initiatives on students' belonging.
Ready to Get Started with Survey Benchmarks?
Benchmarking data is a must-have for districts interested in improving school climate, increasing family engagement, or building students' life skills. Without it, you may be missing part of the picture on how your school community is doing.
The first step is to start gathering baseline data on topics already being measured by thousands of schools across the country. Panorama's open-source student, family, and teacher surveys are a great place to start. You can access our full set of research-backed survey topics and questions in the kit below.