![]()
At San Francisco Unified School District (SFUSD), life skills goes hand in hand with academic performance. Understanding well-being and outcome data has become an integral part of our system, our state, and our nation over the last decade.
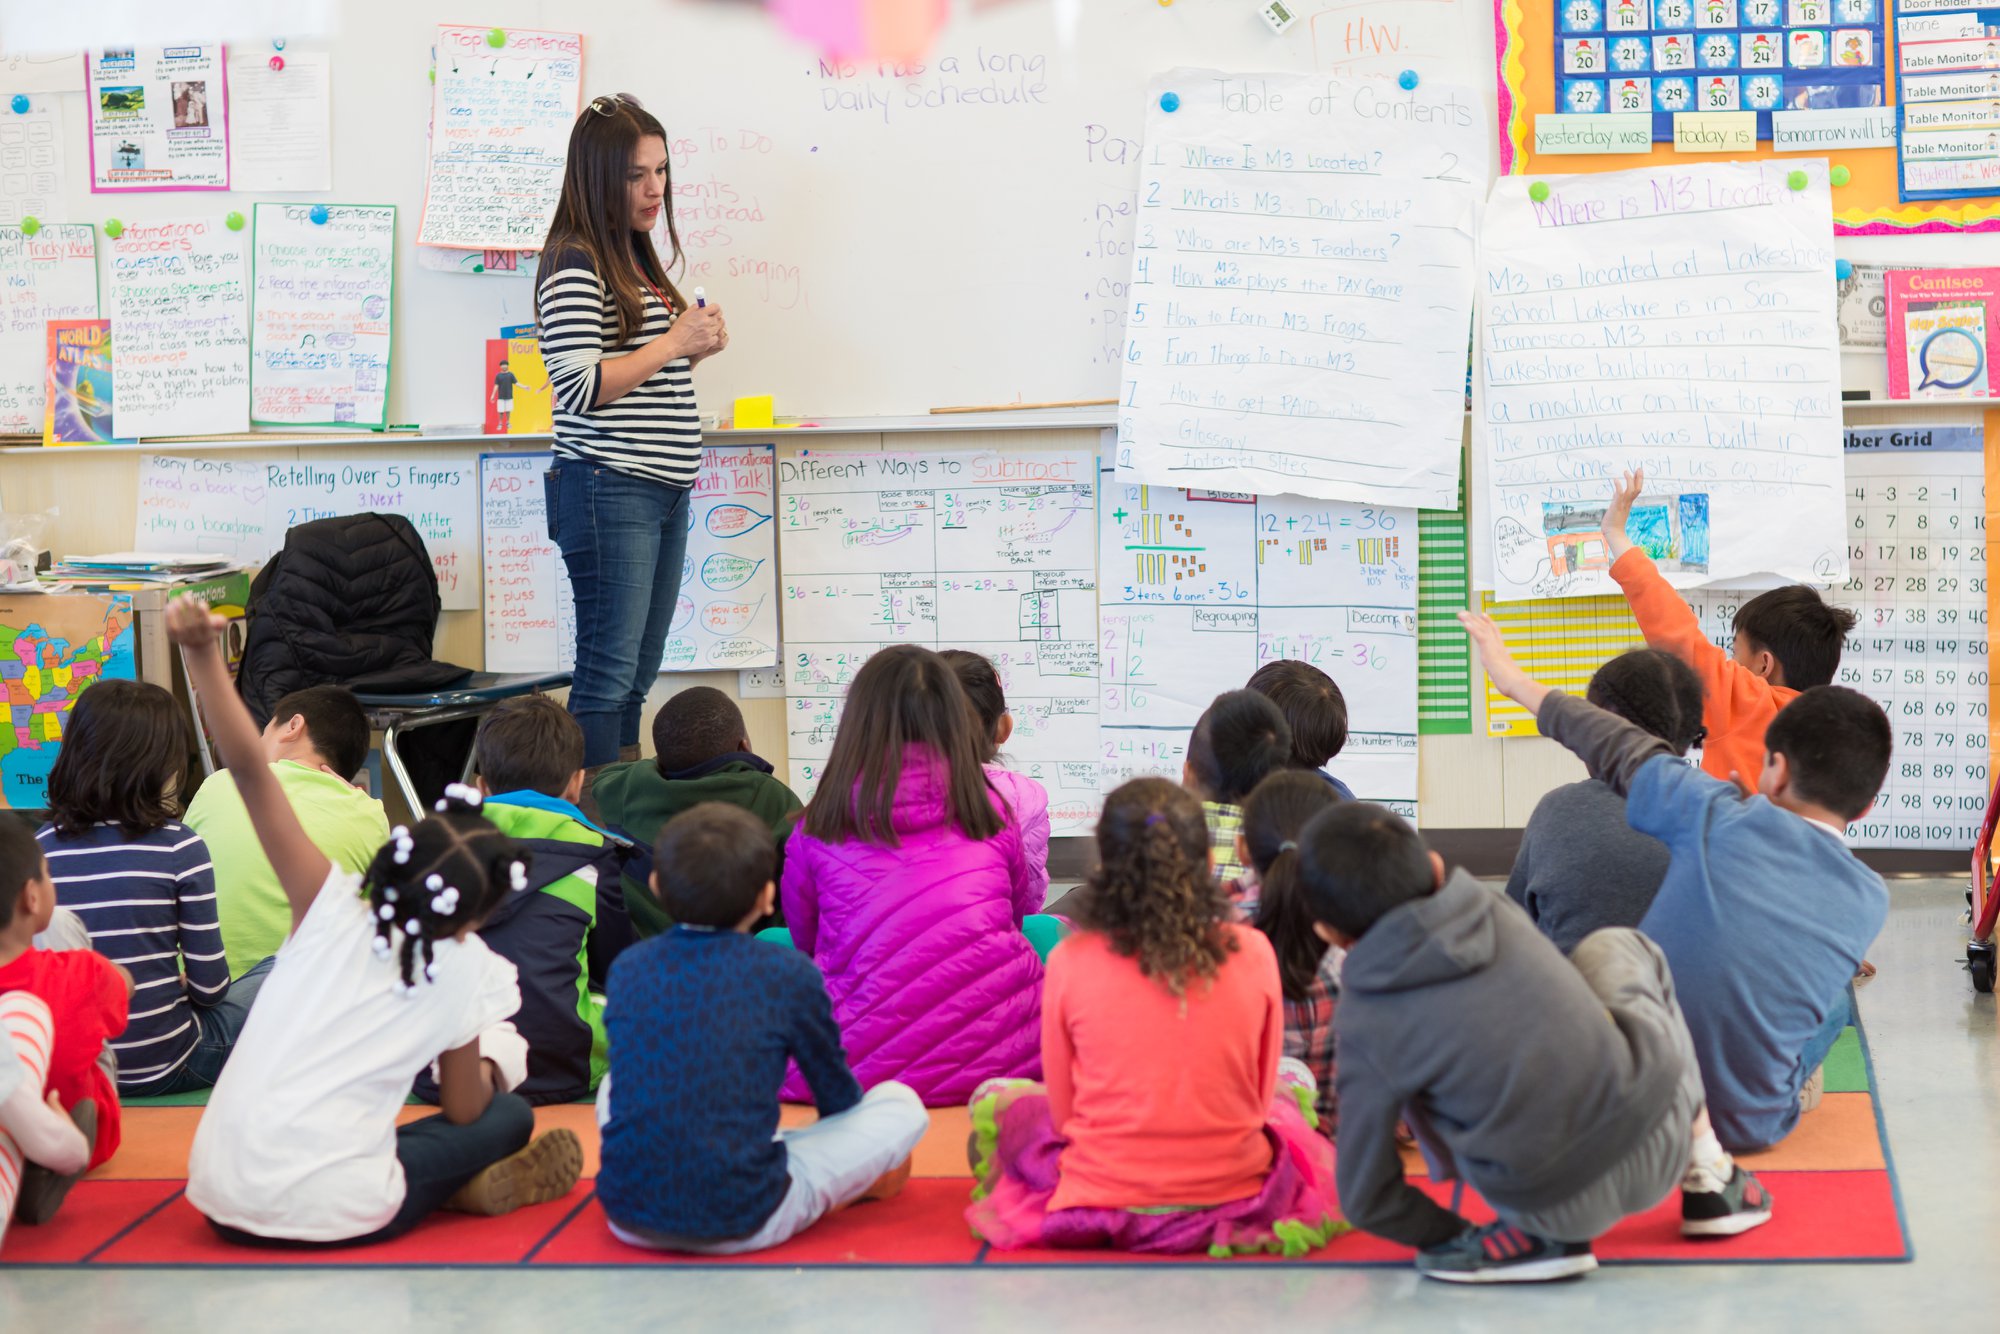
SFUSD is the seventh largest district in California, serving a diverse population of 52,000 students. Our mission is to “Every day, provide each and every student the quality instruction and equitable support required to thrive in the 21st century.” As a school system, we believe that we are here to not only impart knowledge, but to also build the skills, dispositions, and capacity for students to thrive.
In my role as the Chief of SFUSD's Research, Planning, and Assessment Department, I've worked to establish structures and systems around educating the whole child—including through our partnership with Panorama.
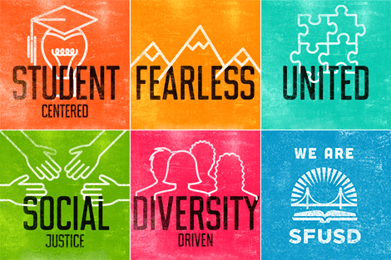 Pictured Above: SFUSD's Core Values
We’ve worked with Panorama for the last seven years to measure climate and culture rom the perspectives of nearly 100,000 students, teachers, staff, and families. Panorama data is a key piece of our accountability system and vision for college and career readiness. Below, I’ll outline SFUSD’s approach to measuring SEL/culture-climate, share a few sample reports, and explain how we use the data as part of a continuous improvement cycle.
"Panorama has helped us tremendously in analyzing and reporting our climate and culture data. The data that we gather—which we always disaggregate to compare results for different groups of students, staff, and families—is primarily for the purpose of continuous improvement. The data is always meant to be a flashlight, never a hammer."
Data as a Flashlight, Not a Hammer for School Improvement
SFUSD has been measuring climate and culture with Panorama since 2015-16. Each year, we’ve measured the following constructs in Panorama to elevate student voice:
- Sense of Belonging
- Support for Academic Learning
- Knowledge and Fairness of Discipline Rules and Norms
- Sense of Safety
- Self-Management
- Social Awareness
- Growth Mindset
- Self-Efficacy
Panorama has helped us tremendously in analyzing and reporting the data. The data that we gather—which we always disaggregate to compare results for different groups of students, staff, and families—is primarily for the purpose of continuous improvement. The data is always meant to be a flashlight, never a hammer. In other words, the data is not intended to draw attention to failures; the data is meant to serve as a resource. We want to shine a light on what’s working while also understanding how we can collectively adjust our systems to support students.
 Pictured Above: SFUSD's Model for Improvement
Sample SFUSD and Panorama Reports
Longitudinal Panorama Data from 2015-16 Through 2019-20
With Panorama, we can explore survey responses year over year to measure the impact of our climate work. The below charts show that student and staff culture/climate responses for all constructs have increased from 2015-16 through 2019-20 for one school site at SFUSD.
Because we use the same constructs for students and for staff, we can look at patterns, similarities, and differences in how they responded to the questions. You may notice that student and staff responses trend in similar directions from year to year.
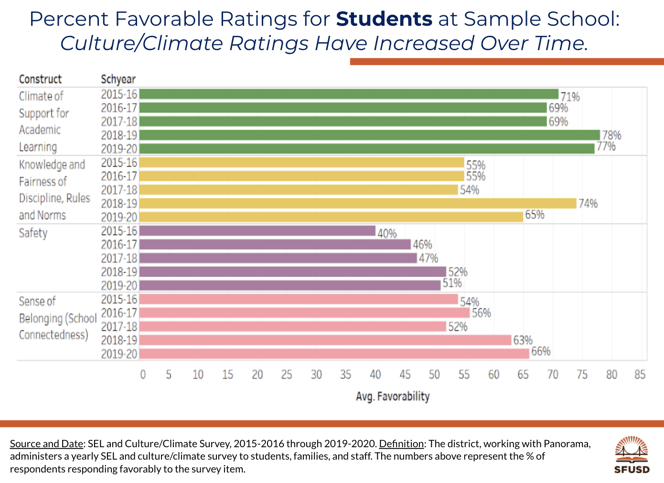 Figure A
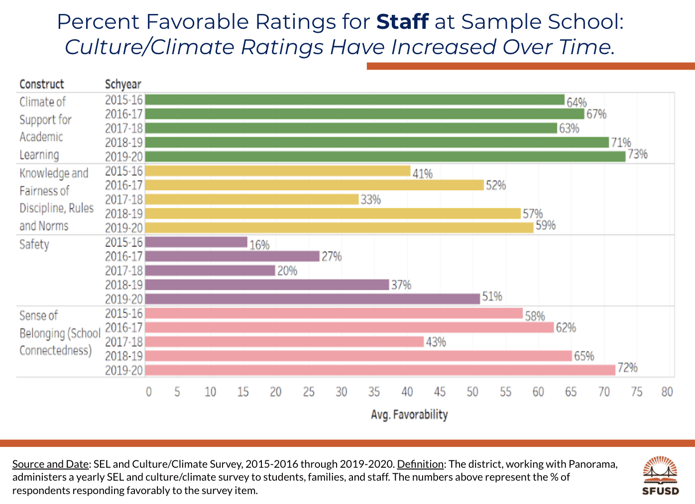 Figure B
The charts (Figures A and B) also show significant increases in Sense of Belonging for both students (12% increase) and for staff (14% increase) at this school site since 2015-16. Over the last two years, this school had prioritized building belonging among students and staff as a key lever for improving academic outcomes.
For example, our middle school cohort developed an “impact chain” theory to measure if improving students’ belonging and connectedness would increase attendance—thereby giving students more access to instruction that could lead to improved literacy.
Disaggregation of Panorama Culture-Climate Data by Student Group
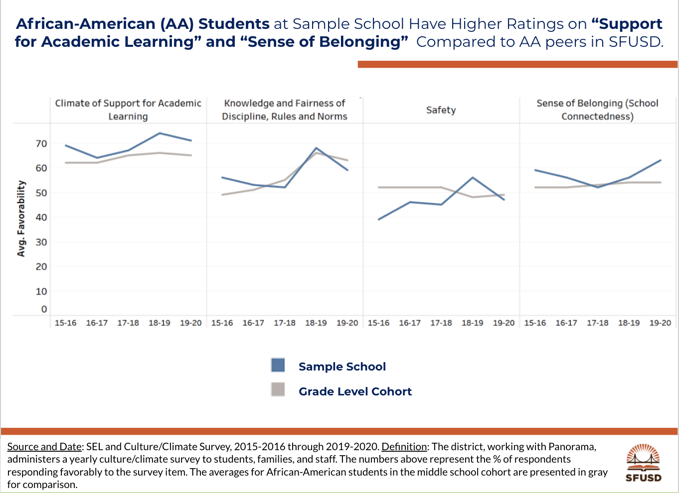 Figure C
We can also disaggregate our Panorama results by race/ethnicity, grade level, socioeconomic status, and more. This chart (Figure C) compares the averages for African-American students at one sample middle school (blue), to the averages for African-American students in all SFUSD middle schools (gray).
It shows that African-American students at this sample middle school responded more favorably to survey questions about Sense of Belonging and Support for Academic Learning than their peers in SFUSD. As a district team, we can then ask: "What can we learn from what this middle school is doing to support their African-American students?"
Summative School Site Reports
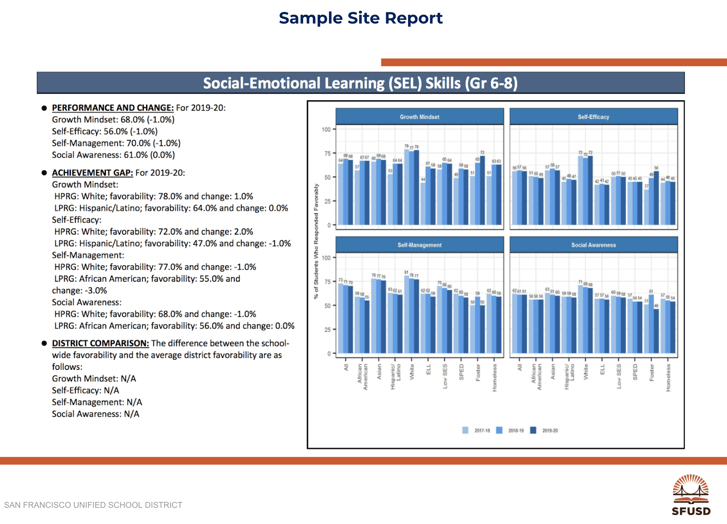
Figure D
At the end of each year, we produce summative reports for each school site that display academics, behavior, and SEL/culture-climate data. This report typically disaggregates longitudinal trends and patterns across various groups of students. It also highlights performance trends and achievement gaps, comparing the data for the specific school site to district-wide trends. The report above (Figure D) shows the summative results for a sample middle school site.
School Improvement Cycles With Panorama Data
SFUSD uses all of our data for continuous improvement. To review our data, we facilitate regular Admin Institute Data Sessions where district leaders come together to look at the connections and relationships between academic, behavior, and SEL/culture-climate data.
To build on those conversations, we also hold site Data Conferences for school teams, including school staff, teachers, and families.

During the site Data Conferences, staff and stakeholders take an iterative approach to testing changes informed by assessment scores, behavioral data, and data for SEL/culture-climate summarized in the Panorama reports. We encourage school teams to ask the following questions:
- What are we trying to improve?
- What changes might we make and why?
- How will we know if the changes led to improvement?
We also provide schools with a Data Conference Agenda and Data Session Worksheets as a resource for school improvement planning. The worksheets help school teams identify the root causes of data, prioritize strategies, and ultimately move from analyzing data to taking action.
At this point, our schools have been through several cycles of collecting Panorama data, and are very proficient or advanced at disaggregating their Panorama reports. Our school teams also appreciate having research-backed strategies in Panorama’s Playbook to implement life skills in the classroom.
I’ve been doing data sessions with schools for 20 years, but I have to say that the addition of SEL/culture-climate data has sparked a new interest and investment in the use of data to drive school improvement.
Dr. Ritu Khanna is the Chief of Research, Planning, and Assessment at San Francisco Unified School District. Dr. Khanna has been at SFUSD for 25 years.