A student perception survey represents a powerful source of feedback for educators and administrators. As student surveys play a greater role in classrooms, schools, and districts, it’s integral to understand the ways that survey instruments can (but don't always) reflect nuanced differences in student perceptions.
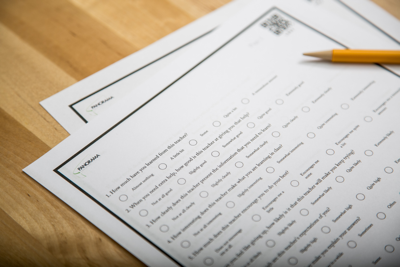
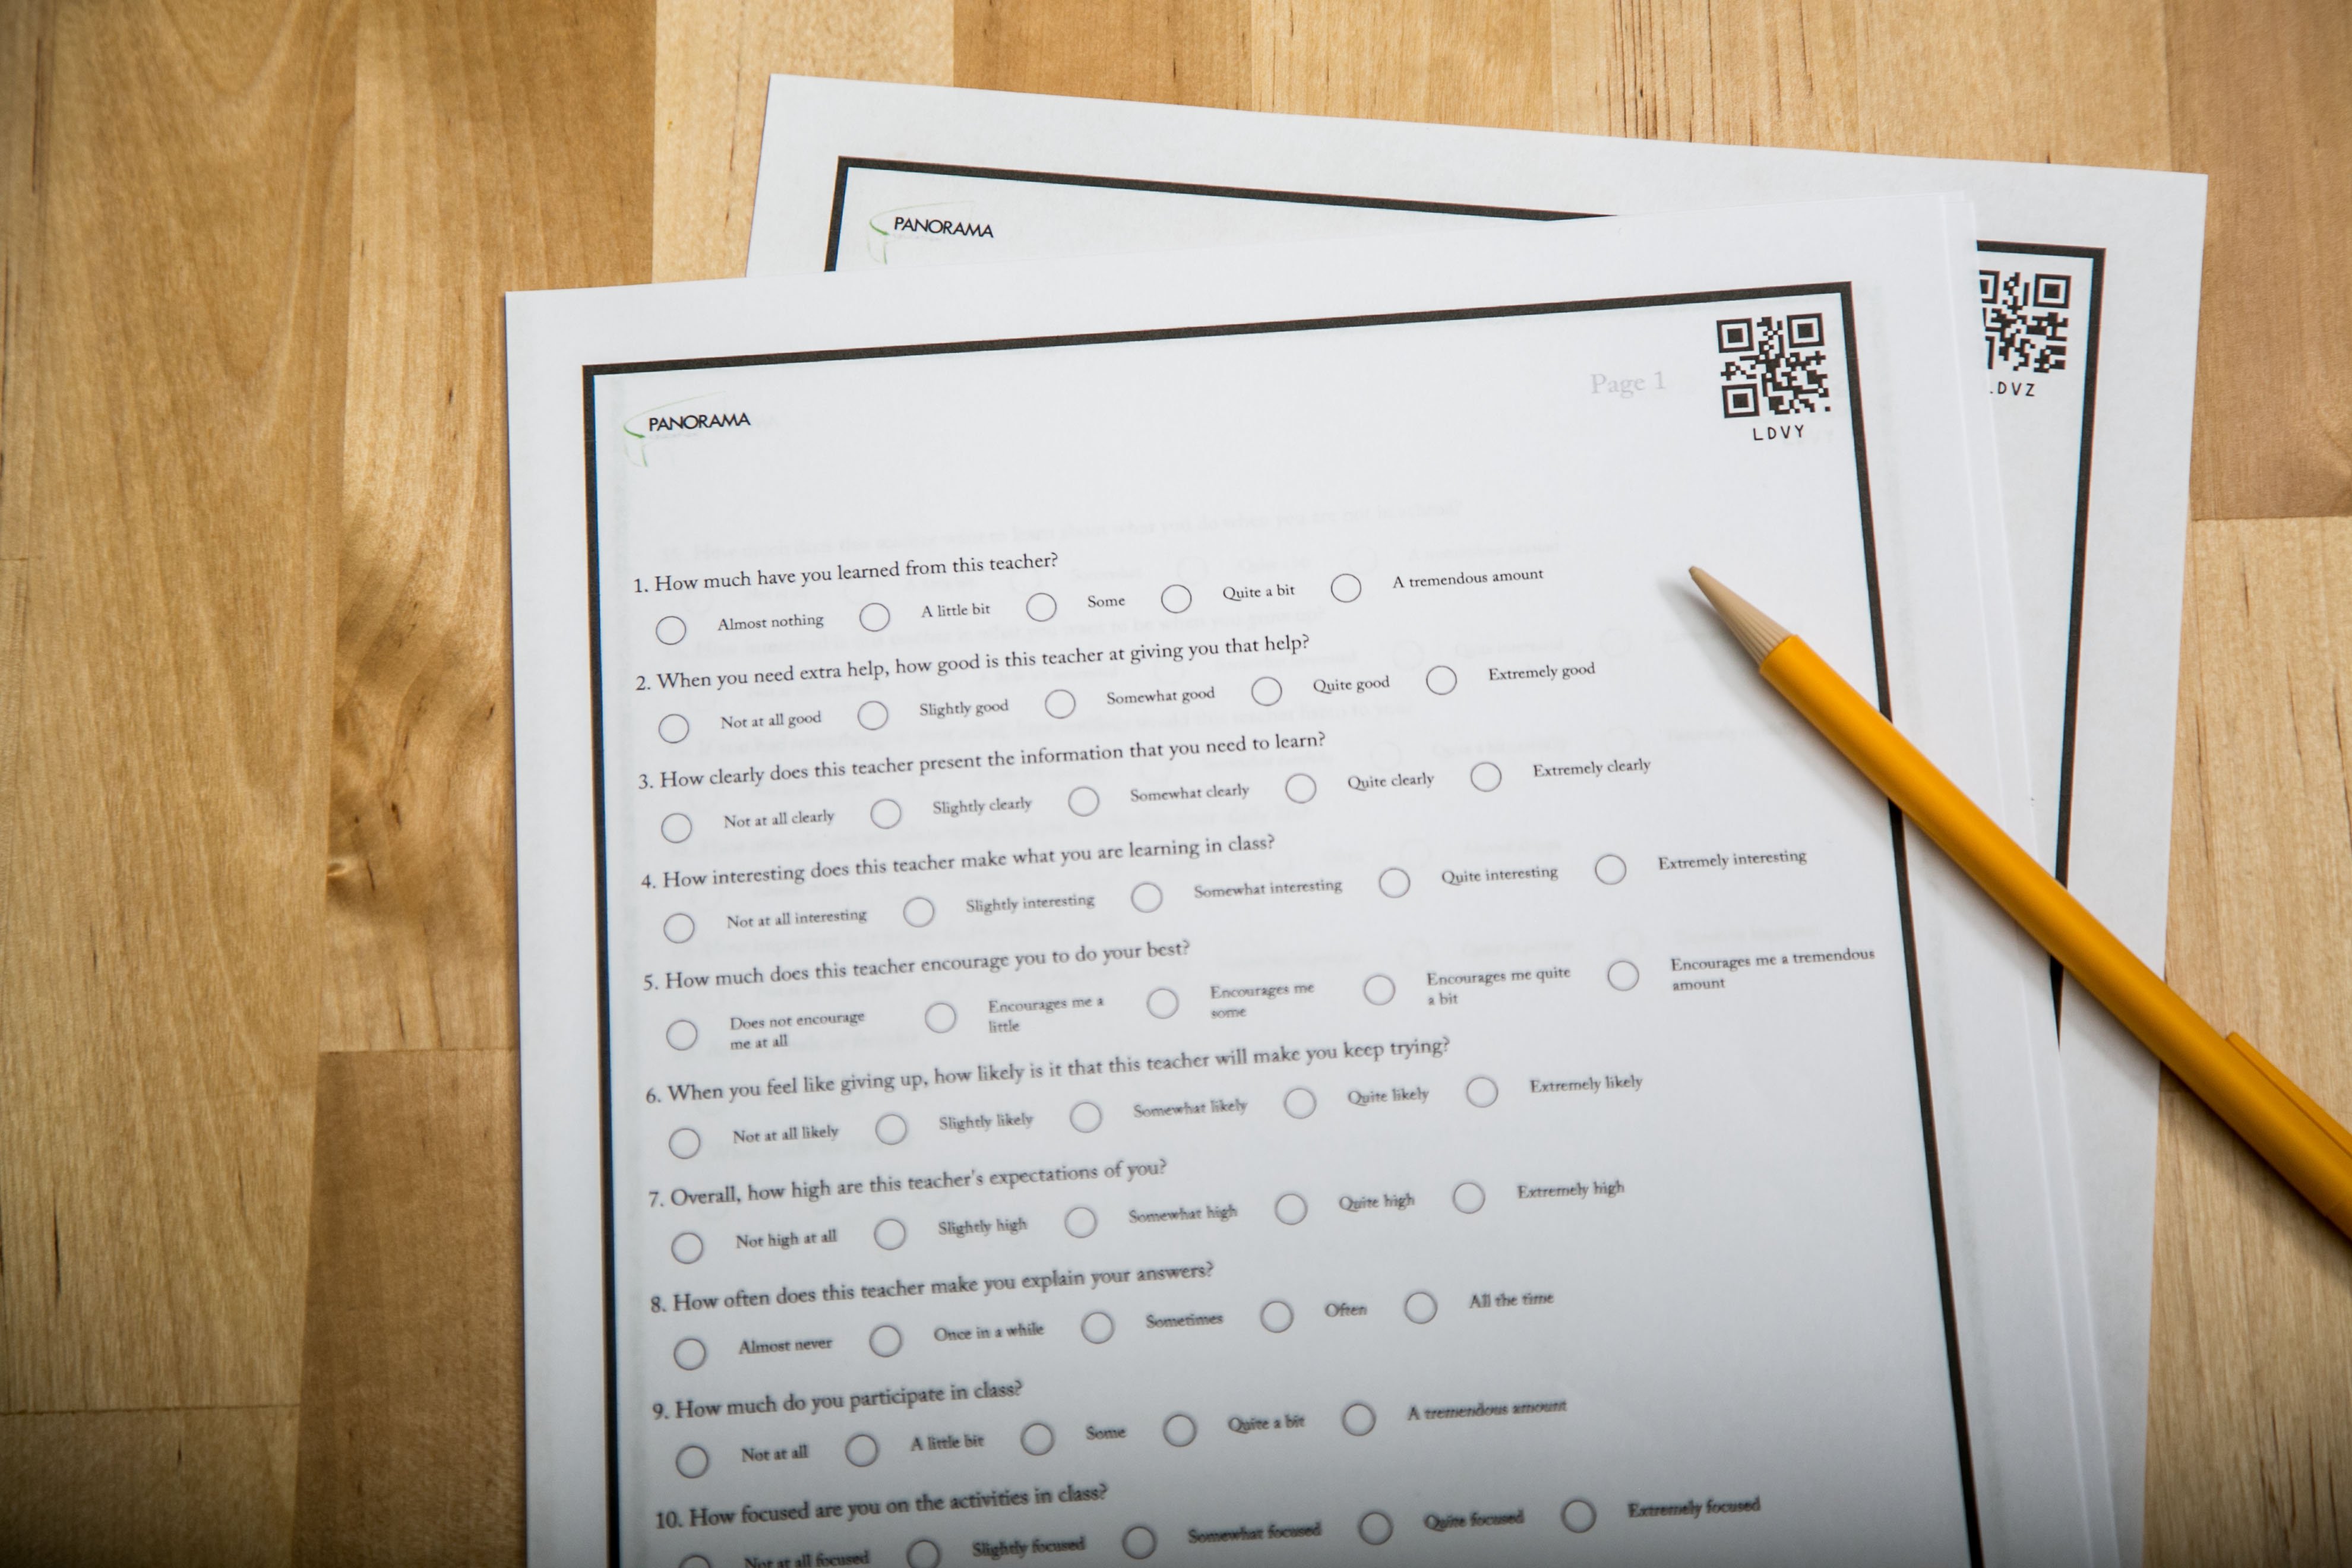
Visit the Panorama Student Survey to view the full set of student survey questions
In trying to determine what makes one student survey instrument a more valuable measurement tool than others, two critical questions are:
Since introducing the Panorama Student Survey as a free student perception survey instrument, we've found that these two questions are crucial elements of a survey’s success in classrooms and schools.
In this post, we'll outline our findings after analyzing 229,674 student responses from the Panorama Student Survey across a range of diverse school districts. In doing so, we can better understand how surveys reflect student perceptions at a larger scale.
To ensure the anonymity and representativeness of the data, we employed several sampling methods:
Variability
Students have a wide range of experiences in classrooms and schools, so a student survey instrument must be capable of capturing these diverse experiences. When educators analyze survey results, these differences should highlight both strengths and weaknesses. Educators will not learn much about their schools and classrooms if all survey responses score in the top 10% of possible answer choices (e.g. "93% of students feel engaged in their classes").
Such overwhelmingly positive results may present a false premise to educators that there is little room to improve. But in an ideal case, student survey data reflects adequately varied feedback across all possible answer choices. An effective survey instrument is capable of capturing differences in student perceptions wherever they exist.
How do most students respond on the Panorama Student Survey?
By using “scales” (groups of survey questions) and by phrasing each survey item as a question (e.g. "How much does this teacher encourage you to do your best?"), the Panorama Student Survey works to minimize the measurement error of individual questions.
While other survey instruments may only reveal a narrow range of responses, our analysis shows the Panorama Student Survey captures an adequate range of variability in student perceptions.
Distinct Measures
As any practitioner will tell you, there are many aspects of effective teaching and learning. But how can you understand the differences between aspects like classroom climate, student engagement, and rigor?
Many student surveys only show how satisfied or unsatisfied students are with their school experience. These surveys often fail to differentiate among the discrete areas of teaching and learning that comprise students experiences in the classroom.
Ideally, a student survey should assess each topic area independently. When measuring student engagement, survey results should reflect the essence of a student’s attention to and investment in their classroom experience. This measurement is distinct from students’ perceptions of classroom climate or teacher-student relationships.
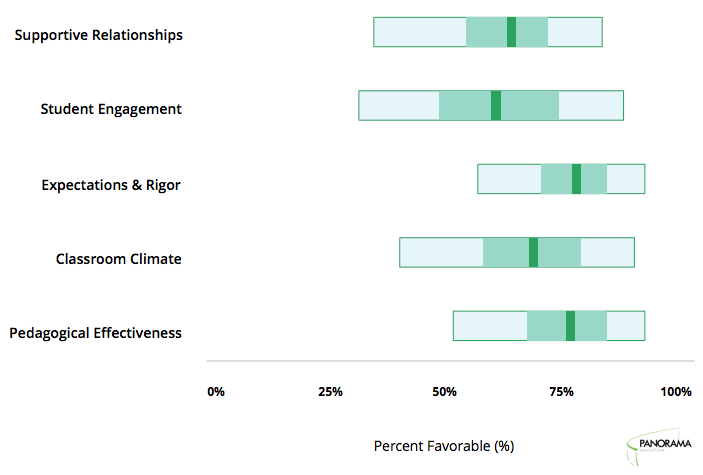
Example 1: Top 20% of survey results on Pedagogical Effectiveness
Example 2: Bottom 50% of survey results on Classroom Environment
These graphs are intended to detail how the Panorama Student Survey distinguishes important aspects of teaching and learning through actual survey data. As shown in these two examples, students who respond high on one topic may respond lower on the next, while others might score low on the first one and higher on the next. The Panorama Student Survey is designed so that each scale measures aspects of teaching and learning independently.
Why is this important? As a teacher, it’s less helpful to receive student survey results that relay “you scored high on every topic” or “you scored low on every topic.” Instead, the Panorama Student Survey can highlight both a teacher’s strengths and areas for improvement, which can be used to guide growth in teaching practice.
Wrapping up
As educators use student surveys in their classrooms, schools, and districts, it’s critical to understand how survey instruments can best reflect student perceptions. That's why we believe the Panorama Student Survey is a valuable measurement tool for educators, as it’s capable of capturing variability in student feedback across several distinct measures.
Interested in learning more? Get in touch with our team for a personalized walk-through of Panorama Surveys and Engagement.
Jack McDermott is a Product Marketing Manager and Won Suh is a Data Scientist at Panorama Education. Follow us on Twitter @PanoramaEd