Last year, we introduced Panorama’s Benchmarks to add greater context to your perception data. Today, we’re excited to launch a key addition to this feature: Peer Benchmarks.
With Peer Benchmarks, you can interact with our national dataset to make relevant comparisons that reflect your school’s context. By selecting from several school-level characteristics, such as urban middle schools with high percentage of students receiving free and reduced priced lunch, the benchmarks distribution graph will instantly adjust to display survey results from schools that reflect these criteria.
As this feature has been several months in the making, we wanted to share our lessons learned from the analytics and design process that created Peer Benchmarks.
What do educators say?
We began by interviewing a number of educators about their use of benchmarking reports. We heard that many educators wanted a better way to see how their survey results compared to schools like theirs.
We were intrigued, so we flipped the question around and asked: “How do you define the types of schools like yours to benchmark against?” Here’s what we heard:
“We want to see schools that reflect our same grade levels and student demographics”
“We want to see how we’re performing compared to both high and low FRPL schools so we can monitor progress towards closing achievement gaps”
With these ideas in mind, we sought to design a tool that would create pathways to better understand the way perception data looks in these schools’ many contexts. We took these qualitative interviews and proceeded to explore a quantitative approach to defining a “peer school” through survey data.
Building better survey benchmarks
We started by examining how results on Panorama’s survey topics (e.g. School Climate or Family Engagement) correlate with a wide range of school characteristics, including: grade level, racial/ethnic diversity, proportion of students eligible for free or reduced-price lunch, region, urbanity, student-teacher ratio, and Title 1 status.
We analyzed these characteristic through multiple statistical approaches and explored different ways to define each characteristic. For instance, we calculated diversity in terms of individual race/ethnicity proportions (e.g. 40% African-American, 30% White, 25% Hispanic, 5% Asian), as well as the proportion of underrepresented minority students (e.g. 65% total).
After analyzing how each school characteristic related individually to topic scores and how groups of variables related collectively to topic scores, we settled on the three variables that displayed the largest relationships with schools’ survey results:
- School Level Elementary, Middle, High School
- School Setting Urban/Non-Urban
- Free and Reduced Price Lunch Status Percentage (FRPL %) Low 0-30%, Medium 30-70%, High 70% or higher
What do the data say?
While there’s extensive research on the ways school characteristics relate to academic performance—such as the effect of poverty or rural settings on student achievement—it’s less clear how characteristics like these relate to perceptions in schools.
So we looked at perception data from over 2,000 schools in diverse communities across the country. Using Peer Benchmarks, we’ve highlighted a couple key findings:
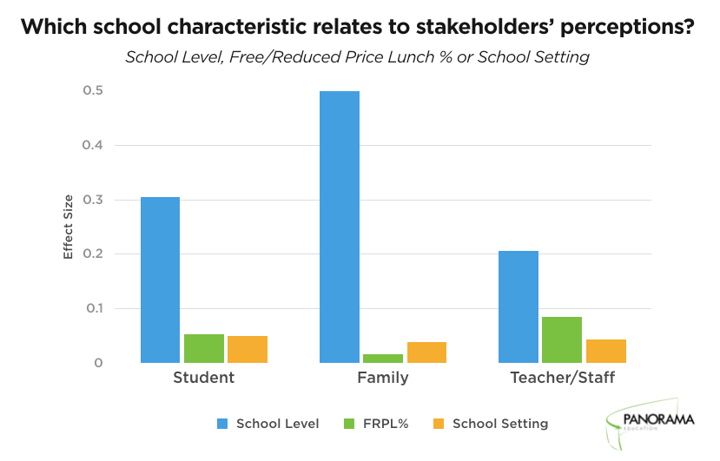
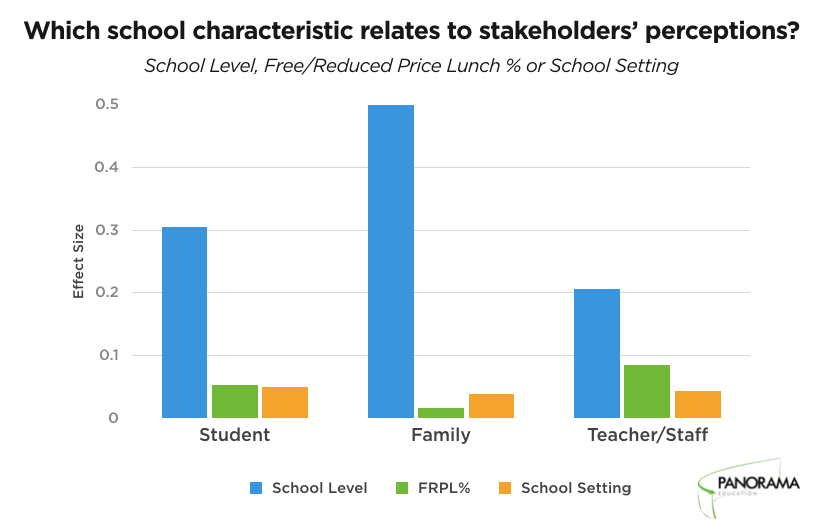
School Level shows the strongest relationship with survey results
Across Panorama’s survey topics (e.g. School Climate, Family Engagement, Growth Mindset), School Level shows the strongest relationship with survey scores. School Setting and FPRL% show far smaller effects.
What’s more, School Level represent the biggest effect by far for all three respondent groups. The other relationships vary somewhat, as FRPL % is bigger than School Setting for teachers/staff, yet School Setting is bigger than FRPL % for families.
Students’ views on School Climate become less positive in higher School Levels
As students move from elementary to middle to high school, their positive views of School Climate tend to decrease. This survey topic includes questions like “How fair or unfair are the rules for the students at this school?” and “How often do your teachers seem excited to be teaching your classes?”
In this animated screenshot that uses Peer Benchmarks, it’s clear how a score of 63% favorable (the pink line) is actually quite different at each School Level. This score is near the bottom 50th percentile for elementary schools, but moves up to the 90th percentile for high schools; a change of forty percentage points on the same survey topic based on School Level.
Why is this important? If you’re a district administrator, these comparison points provide a more accurate picture of your schools’ survey results by comparing “apples to apples;” that is, how your elementary schools compare to other elementary schools nationally.
What’s next for Benchmarks
We hope this Peer Benchmarks will help educators find deeper meaning in their perception data. By providing comparisons that are both relevant and contextual, this tool can shine a spotlight on the ways stakeholder perceptions may vary across many school characteristics.
There’s still work to be done. We’ll continue to expand the number and depth of comparisons we support across additional school characteristics. We’re also excited to hear from you: what do you want to see in Peer Benchmarks?
Leave us a comment or tweet at @PanoramaEd. We look forward to benchmarking with you!