.jpeg)

Strong data systems play a vital part of any Positive Behavioral Interventions and Supports (PBIS). Ensuring PBIS teams have access to behavior data for your school district is a good starting point—but knowing how to use it to drive change for your students is critical. When educators know what to look for, district and school-wide behavior data can be used to determine what areas need to be top-of-mind for caring adults in schools.
What is the Big 5?
To unpack your data and better understand how to take action, try looking at it through the lens of the “Big 5”:
The answers to these questions can provide important context for decision-making around Tier 1 interventions, the foundation of a successful PBIS implementation. Interventions at Tier 1 serve students across all environments, setting school-wide expectations so students can learn what positive behaviors look and feel like. This is why understanding the big picture of behavior data is so important: You’ll be able to see which areas are successful and which areas need further support, and you’ll be able to determine what actions are needed in order to ensure every student is having a positive experience at school.
In this post, we’ll dig into what these questions reveal about student behavior data and provide examples of how you can use the Big 5 to get a clear picture of Tier 1 interventions in your school or district.
Empower your team to make data-based decisions with our free PBIS Team Toolkit
Digging Into the Big 5: What, Where, When, Who, and How Often
1. What behaviors are being reported most frequently?
This question gives your team insight into the types of behaviors that are being reported most often. From here, you can determine what replacement behaviors you would like to see instead and develop a plan for skill-building and supporting students for engaging in those more positive behaviors.
Example: An elementary PBIS team reviews the data at a team meeting and notices a large amount of office discipline referrals for “disruptive behaviors.”
2. Where are these behaviors being reported?
Knowing where in school buildings or on campus behavior incidents are occurring can provide insight into reasons why they might be happening and what interventions might be most helpful. Consider what you know about these locations, and how caring adults can serve students more effectively there.
Example: The team discovers that many of the referrals for “disruptive behaviors” are occurring in the hallways.
3. When are these behavior incidents happening?
Understanding the time of day, time of week, or time of year that you are seeing these behaviors can help you understand why the behaviors are happening and determine the best course of action for addressing them. How can you serve students more effectively during these times?
Example: Most of the referrals for “disruptive behavior” are occurring on Friday afternoons.
4. Who are the students, or groups of students, demonstrating these behaviors?
Tier 1 supports are designed for all students. When behavior starts to get in the way of learning, it’s important to make sure that Tier 1 supports are in place with high levels of fidelity across all environments and all students. Ask whether all students have equitable access to Tier 1 supports, and if you are noticing any trends of discipline disproportionality for particular groups of students.
Example: The team notices that the students being referred are 4th graders who are coming back from P.E. class on Friday afternoons.
5. How often are these behavior incidents occurring?
Looking at the increase or decrease in frequency of incidents over time can give your team visibility into the efficacy of interventions and programs. What do the number of referrals tell you about the health of your Tier 1 initiatives?
Example: By looking at the pieces of data together, the PBIS team knows that a large amount of behavior referrals for “disruptive behavior” are happening on Friday afternoons in the hallways as 4th grade students are returning from P.E. class. The PBIS team decides to work with the 4th grade teaching team to use behavior-specific praise to help the students exhibit the desired behavior, which in this case is walking quietly in the hallway. The PBIS team can monitor this situation throughout the school year to see whether the intervention put in place is causing the frequency of behavior referrals to change over time.
Using Behavior Data to Make Informed Decisions
Individually, these questions only tell part of the story. When you look at the Big 5 together, your PBIS team can view behavior data holistically to evaluate the impact that Tier 1 supports are having for students and school climate, and make informed decisions to improve the school experience for everyone.
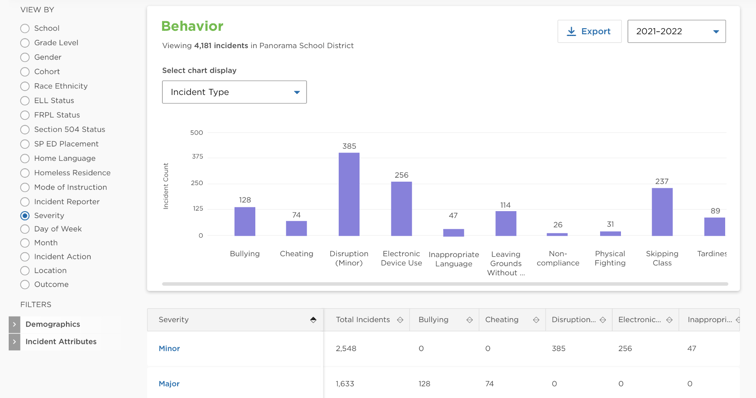
Panorama Behavior Logging & Analytics showing what behaviors are being reported most frequently. (Please note that demo data is pictured.)
Panorama Behavior Logging & Analytics you to see all of your school or district’s behavior data in one place so you can make informed decisions about resources, programs, and educator supports. Panorama’s powerful visualizations show Big 5 trends, major and minor incident rates, and more. Contact our team to see how Panorama Behavior Logging & Analytics can support your district.