
16 million. This is the number of students who are chronically absent in the United States. In fact, annual chronic absenteeism rates—reflected in Panorama’s own data—nearly doubled from 2018-19 to 2023-24. That’s roughly double the number of students who were chronically absent before the pandemic. Here we break down what chronic absenteeism is and what your district can do to prevent students from becoming chronically absent.
What is Chronic Absenteeism?
Chronic absenteeism refers to a pattern of excessive absence from school, typically categorized by missing a significant number of days over a given period. There are different ways that chronic absenteeism can be measured and calculated, but all research points to ongoing issues as a result of chronic absenteeism.
The effects of chronic absenteeism are overwhelming, so it is important to address the situation of absent students before it gets to the chronic level. Research shows that chronic absenteeism correlates with negative outcomes for students. The Brookings Institution compiled evidence showing:
-
In Baltimore City Public Schools 6th grade chronic absenteeism was the strongest predictor of not graduating high school.
-
Chronic absenteeism in kindergarten is associated with lower reading and math achievement in later grades.
-
Chronic absenteeism is also linked to poor well-being.
Addressing chronic absenteeism requires more than just tracking attendance—it means understanding the underlying causes, from health and transportation barriers to school climate and engagement. By identifying patterns early and supporting students holistically, schools can prevent occasional absences from turning into long-term disengagement.
What Causes Students to be Chronically Absent?
There are many different reasons why students are absent, but Panorama's recent State of Chronic Absenteeism Report found the school that a student attends matters to absenteeism. Controlling for student attributes and learning needs, as well as school poverty level, the school attended still influences the likelihood of a student being chronically absent by as much as 22%.
Additionally, specific survey topics correlate strongly with chronic absenteeism. School safety and climate are most linked to absenteeism in elementary and middle schools, with social awareness most linked to absenteeism in high schools.
You can learn more about these influencing factors and get specific, research-backed strategies to address these root causes of chronic absenteeism in our complete report.
Why is Measuring Chronic Absenteeism Important?
While the need to improve attendance is evident, the path to improvement is not always clear. There are many strategies for getting students to attend school regularly—from improved transportation to communication with families to creating a school climate where students want to be.
But without data to understand trends and monitor student attendance, educators cannot effectively employ chronic absenteeism interventions. It can also be difficult to aggregate, interpret, and take action on attendance data at the student, school, and district levels.
The Role of Data in Improving Attendance
There are many ways to define, measure, and analyze data about students’ attendance. For example, average daily attendance represents the overall percentage of students that are present in school. Chronic absenteeism rates capture the percentage of students that have missed a more extreme number of days.
These metrics can offer very different insights for school leaders. According to research from Attendance Works, an organization that promotes better attendance through policy and data, a school with 200 students can have 95 percent average attendance and still have one in every four students be chronically absent.
That's why school leaders today are using MTSS platforms and data analytics to monitor and improve student attendance. When working to improve attendance, you need insights that answer questions like:
- Which students have been chronically absent this year?
- Which students have missed several days of school in a row and are at-risk of falling behind?
- Which students are receiving or still need to receive attendance interventions?
- How do our average daily attendance patterns vary across student groups?
- Are we on track to hit our school or district’s goal for attendance this year?
5 Ways Attendance Dashboards Can Help Student Succeed
Panorama Student Success, the market-leading K-12 platform for helping districts translate insights into effective student supports, provides educators with a complete view of students’ progress across attendance, academics, behavior, graduation, and life skills. With interactive attendance reports and dashboards that refresh daily, Panorama offers clear indicators that district leaders and educators can use to take data-informed actions and provide appropriate support to address chronic absenteeism.
1. Quickly monitor district and school-level attendance trends and early warning indicators
Teachers, interventionists, counselors, and administrators can easily view district and school-level trends for the percentage of students that are “on track” and “at risk” of attendance issues. By refreshing your data on a daily basis, Panorama Student Success provides a near real-time view into a school’s attendance patterns.
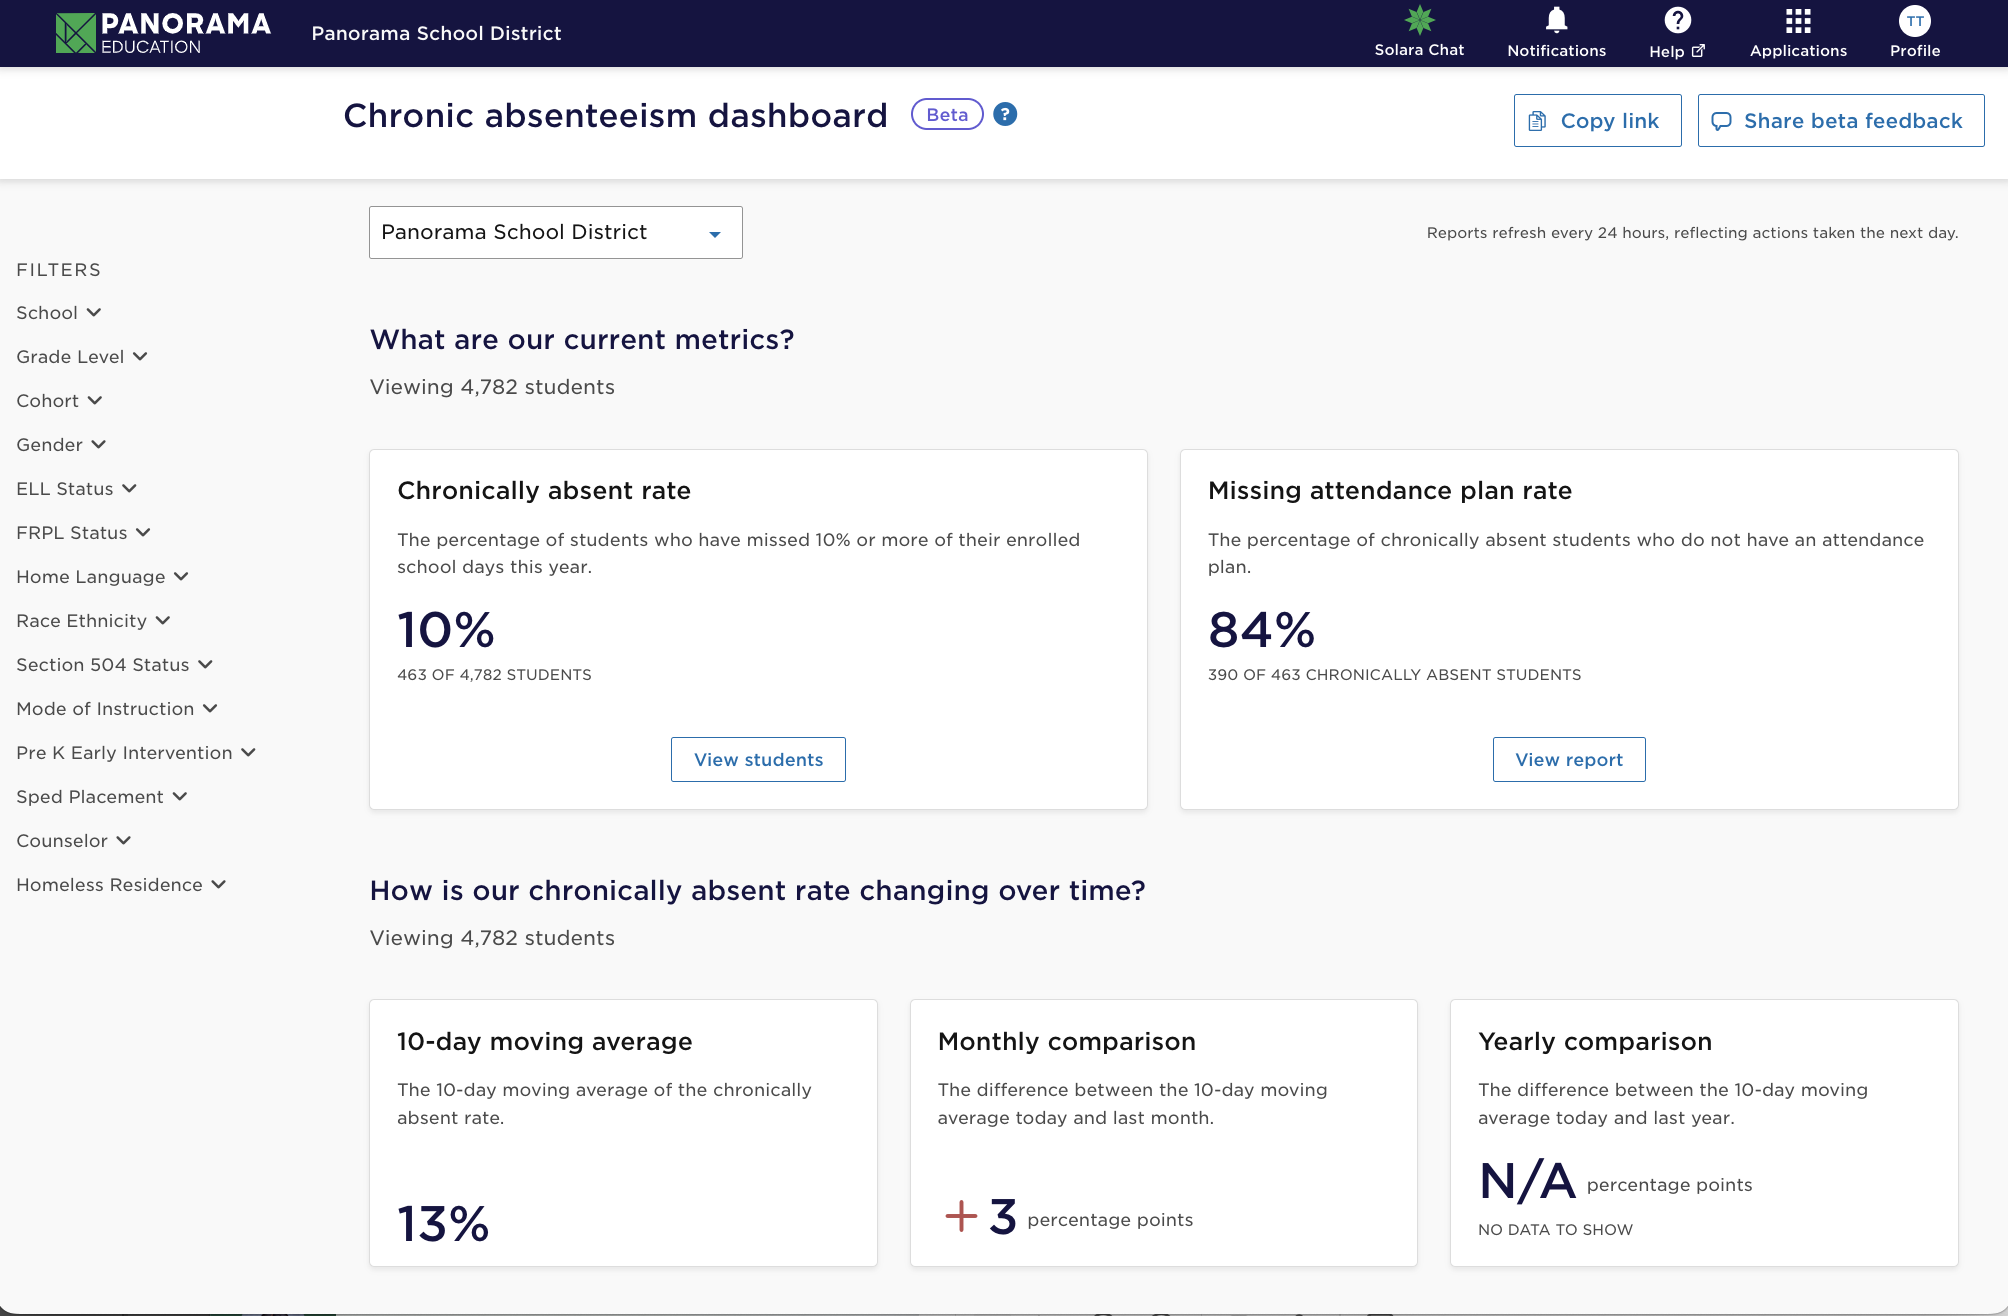
The Chronic Absenteeism Dashboard enables district and school leaders to monitor attendance trends, evaluate progress, and develop strategic plans to address chronic absenteeism within their districts and schools.
2. Create intervention plans for students who are chronically absent
Educators can use a “Chronic absenteeism intervention gaps report” report to understand district-level chronic absenteeism using the district level view or identify chronically absent students using the student level view. Panorama Student Success analyzes each student’s attendance. It identifies students who have missed 10% or more days of the current school year, and shows whether those students have an attendance intervention plan or not. Once the report helps identify students who are chronically absent, educators can quickly create an intervention to support them.
3. Discover students who have recently been absent to enable early intervention
Use Panorama Student Success’s “Recently Absent Students” report to find students who have missed three or more of the last 10 school days. Use this report to identify early signs of potential chronic absenteeism, and to check on students who are missing school to understand why and how to best support the student’s education.
4. Dive deeper with daily and course section attendance charts
Understand a student's attendance patterns with calendars that show full-day absences, absences from specific courses, or tardies. See which classes a student misses most frequently—and their grades in those courses—to take action before they fall behind.
5. Understand the “why” behind absences.
Get a wider picture on how each student’s attendance patterns compare to their progress in academics, behavior, and life skills. Quickly see each student’s early warning indicators across multiple measures to better understand why a student is facing challenges with attendance, and make data-informed decisions to tailor the support a student needs.
Addressing Chronic Absenteeism with AI
Panorama Solara is a customizable, district-managed AI platform built to drive outcomes for students and educators across academics, personalized instruction, and student support. Designed specifically for K–12, Solara is grounded in rigorous security and privacy protections. Solara draws from your high-quality instructional materials and data—including academics, behavior, attendance, and life skills—so it truly understands your students, processes, and goals.
Solara helps districts uncover the “why” behind absenteeism, identify patterns early, and guide timely, targeted interventions that keep students connected to school. By uniting attendance insights with academics and life skills data, Solara empowers educators to improve daily engagement and build stronger pathways to long-term success.
Chronic Absenteeism Insights
To go deeper, Chronic Absenteeism Insights, available in Student Success and powered by Panorama’s AI, helps uncover what’s driving those patterns. By connecting attendance data with Panorama survey responses—like students’ sense of belonging and school climate—you can move from surface-level stats to a more complete understanding of what’s contributing to absenteeism in your district.
These insights aren’t just AI-powered—they’re research-backed. Our research team analyzed complete attendance information for over 7,000 schools and 11 million student records, finding strong correlations between chronic absenteeism and key indicators like school safety, teacher-student relationships, and belonging. We infused those findings directly into the design of Chronic Absenteeism Insights, enabling the platform to surface root causes based on your district’s unique data context.
Coming Soon: Solara AI Agents
We’re also rolling out the first use case of Solara AI Agents, which are designed to take on complex, time-consuming workflows while keeping educators fully in control.
First up (and available as beta to customers): an AI Agent for attendance intervention planning, built right into Panorama Student Success. Educators can create research-backed, personalized plans in minutes, helping MTSS teams move faster and with greater clarity.
What's Next?
The need to improve attendance is clear, but the how isn’t always obvious. That’s why we created a toolkit of 19 evidence-based interventions. Each strategy is proven effective when it comes to authentically engaging families and their students to improve attendance.
When students attend regularly, they’re more likely to learn, engage, and thrive. These interventions will help you get them there.